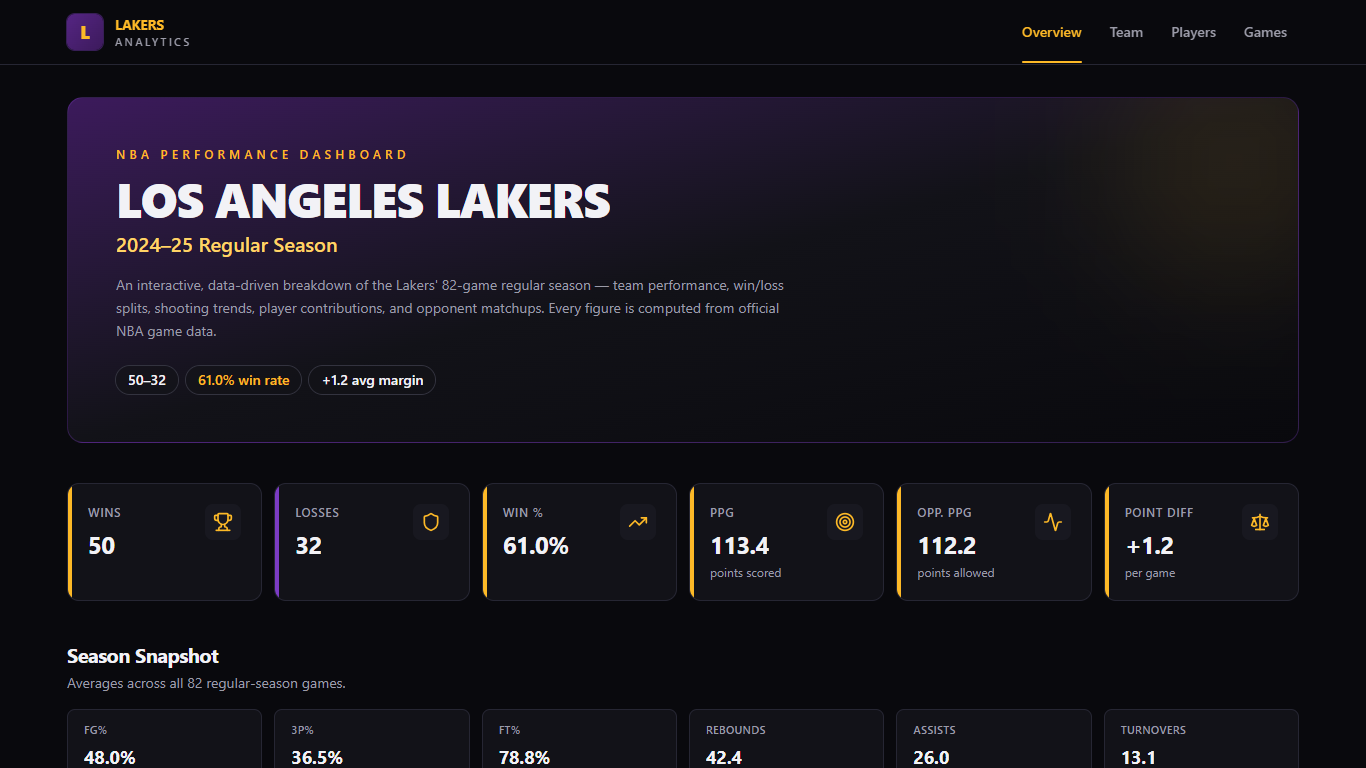
1. Overview
Season record, KPI cards, win/loss timeline, scoring trend, and point-differential chart.
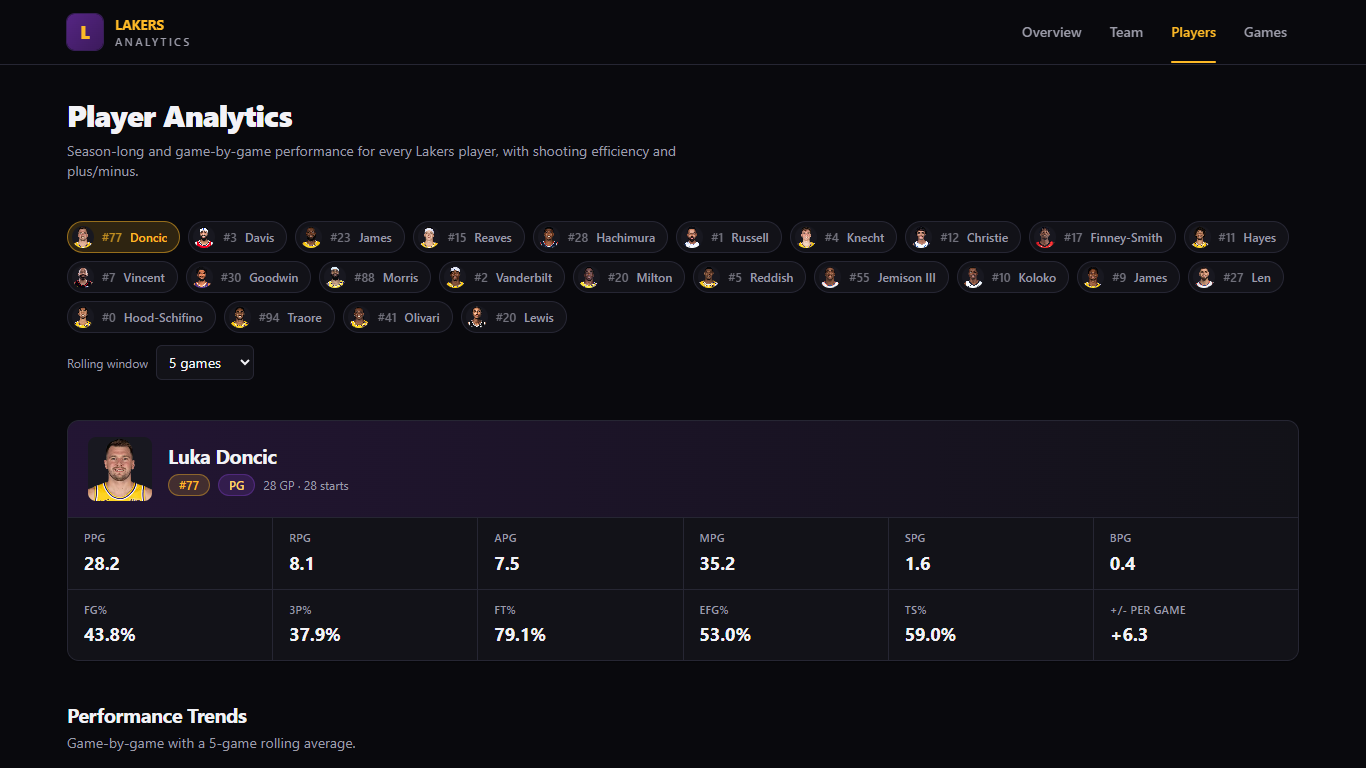
2. Player Analytics
Player selector, summary card, sortable season table, per-game trends, and two-player comparison.
Lakers Analytics Dashboard
A Client-Side NBA Analytics Dashboard for the Lakers' 2024–25 Season — Built from a Real Data Pipeline, a Pure-Function Analytics Engine, and an Interactive React UI
At a Glance
- Problem
- A full season of box scores is dense and hard to explore — no interactive way to see trends, player development, or what stats associate with wins.
- Role
- Built the full application end-to-end: the data ingest pipeline, the analytics engine, and the React dashboard.
- Solution
- A client-side dashboard with four routed views, fed by a static dataset ingested from the NBA's official feed, with pure-function analytics.
- Result
- All 82 games rendered into interactive charts, sortable tables, and data-driven insights — computed client-side from static files, no backend.
- Proof
- Live demo, GitHub repository, and the methodology and architecture below.
Executive Summary
Lakers Analytics is an interactive, data-driven web application that analyzes the Los Angeles Lakers' 2024–25 regular season. It turns a real-world dataset — ingested from the NBA's official public data feed — into structured analytics and an interactive frontend.
The deployed app reads only static JSON files and never hits the network for data at runtime. Every chart and insight is derived from the actual dataset; nothing is hardcoded or fabricated. The project is built with React, TypeScript, Vite, Tailwind CSS, and Recharts, with no backend, database, or authentication.
Data Pipeline
Data comes from the NBA's official public data feed (data.nba.com). A Node ingest script fetches the league schedule and all 82 Lakers regular-season box scores, normalizes them, and writes three static JSON files:
games.json— 82 games with team box scores (Lakers & opponent).players.json— Lakers roster derived from box scores.playerGameStats.json— per-game, per-player stat lines.
A development-time validation script verifies the dataset is internally consistent: unique IDs, correct scores and point differentials, valid references, 82 games, and score sums matching player point totals. Player headshots load from the NBA's official image CDN, keyed by the same NBA player IDs, with a graceful initials fallback.
Architecture
The codebase separates data, analytics, and presentation so that business logic never lives inside components:
- Static JSON (
src/data/) — the processed dataset and typed accessors. - Analytics layer (
src/analytics/) — pure functions for team, game, and player analytics plus generated insights. No analytics logic lives inside components. - React UI (
src/pages/,src/components/) — presentation only; pages are lazy-loaded with Suspense. - Charts & tables — Recharts for visualizations and a reusable sortable DataTable.
Analytics Methodology
Win / Loss Comparison
Each box-score stat is averaged separately for wins and losses, then the difference is reported. Differences are described as associated with winning games — never as causes.
Home / Away Splits
The season is split by venue to compare records, win percentage, scoring, and average margin at home versus on the road.
Player Efficiency
Per-game lines aggregate into season stats, with derived efficiency metrics — eFG% (FGM + 0.5·3PM) / FGA and TS% PTS / (2·(FGA + 0.44·FTA)) — using safe division handling.
Correlation
Pearson correlation between each stat and (a) point differential and (b) win/loss outcome, presented with an explicit "correlation does not imply causation" disclaimer.
Features
- Overview (
/) — season record, KPI cards, win/loss timeline, scoring trends, point-differential chart, and monthly performance. - Team Analytics (
/team) — what changes when the Lakers win, shooting/rebounding/ball-movement stats, home vs. away splits, correlation scatter plots, and data-driven Key Insights. - Player Analytics (
/players) — player selector, summary card, sortable season table, per-game trends with an adjustable rolling window, efficiency metrics, plus/minus, and a two-player comparison mode. - Games & Opponents (
/games) — filterable, searchable game log, head-to-head box-score comparison for any game, and a sortable opponent table.
Honest Limitations
- Single season, one team: findings reflect one 82-game regular season for one franchise; they are descriptive, not predictive.
- Regular season only: playoffs and pre-season are excluded.
- Correlation ≠ causation: observed associations do not imply that a statistic causes wins or losses.
- Small samples: head-to-head opponent records and per-player monthly splits can involve very few games and should be read cautiously.
Need a data dashboard or analytics tool?
Let's coordinate to build interactive dashboards, data pipelines, or reporting interfaces tailored to your dataset.
Get in Touch →